
How Standardised Reman Trucks Support Consistent Ton-Kilometre Cost Forecasting For Long-Haul?
Intro
Ton‑kilometre (t/km) is the core financial metric for long‑haul fleets. It rolls together fuel, maintenance, depreciation, insurance, tyre wear, downtime and capital cost into one figure used for contract pricing, route bidding and monthly performance tracking. Forecasting this metric becomes unreliable with mixed, undocumented used trucks.
One unit may run efficiently for months, while another suffers sudden component failure that blows the average t/km out of target. Standardised reman trucks locks in a uniform rebuild baseline for same‑model, same‑grade units, turning t/km forecasting from guesswork into a repeatable model.
Why Traditional Long-Haul Fleets Struggle With Ton-Kilometre Predictability?
Generic used trucks carry unknown prior abuse, ad‑hoc repairs and mismatched powertrain calibrations. Engine compression, transmission efficiency, brake drag and internal friction vary widely unit to unit. This creates variable fuel burn, inconsistent service demand and unpredictable failure timing. When building a t/km forecast, planners are forced to add large risk buffers.
The buffer may be too high and make bids uncompetitive, or too low and erode margin when unexpected breakdowns hit. For long‑haul routes that run thousands of kilometres over weeks or months, small per-kilometre variances compound into large total cost deviations.
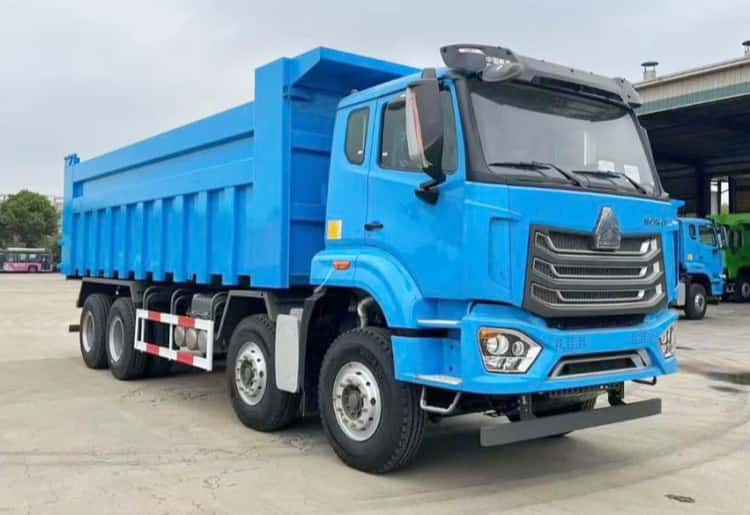
Standardised Powertrain Calibration Delivers Narrow Fuel Consumption Bands
Every REMAN ROAD standardised reman trucks of the same model and duty grade undergoes identical bench testing and calibration. Engine clearances, injection parameters, transmission shift points and brake system drag are validated against fixed tolerance bands.
The result is tightly clustered fuel consumption across the fleet. Instead of a broad range of litres per 100 km, the fleet can use a single, defensible fuel assumption for t/km modelling. Since fuel is the largest component of long‑haul ton‑kilometre cost, this consistency alone removes most forecast volatility.
Uniform Wear Curves Make Maintenance Costs Per Kilometre Predictable
Uncertified used trucks wear at random rates. Bearings, seals and driveline parts may fail early or last far longer, with no way to model the cycle. Standardised reman includes mandatory renewal of high-cycle consumables during rebuild, plus published service intervals tied to operating distance.
Maintenance planners can calculate expected part replacement frequency based on total kilometres travelled, not reactive breakdown events. Maintenance cost is expressed as a stable per-kilometre line item in the t/km model, rather than an open-ended contingency.
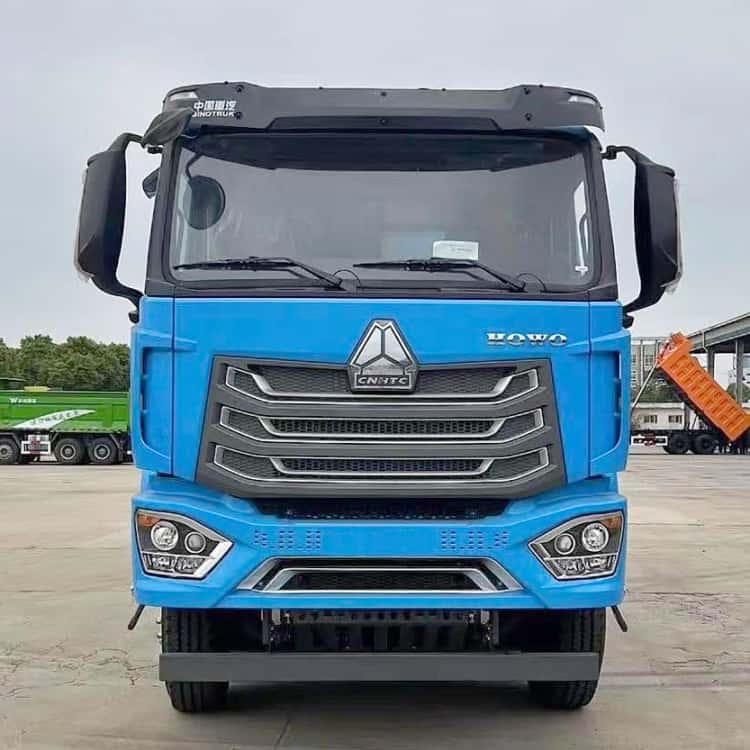
Reset Depreciation and Grade-Based Residuals Stabilise Capital Cost Per Ton-Kilometre
Capital cost spread is another major source of forecast error. Ordinary used trucks depreciate along uncertain curves, heavily discounted by unknown history. New trucks carry steep early depreciation. Standardised reman trucks uses the reset lifecycle depreciation model starting from rebuild completion, with residual values anchored to REMAN ROAD duty-grade benchmarks.
When calculating capital recovery per tonne‑kilometre, the same depreciation and residual assumptions apply to all matching standardised reman trucks. This avoids averaging wildly different asset value trajectories, which distorts blended t/km calculations in mixed fleets.
Warranty Bounds The Downside Risk In The Forecast
Long‑haul t/km models need to account for unplanned downtime and repair expense. For standardised reman trucks, rebuild-related structural and powertrain failures are covered under warranty. The maintenance contingency only covers misuse, overload damage, tyre replacement and normal wear outside the rebuild scope.
This creates a hard, defensible upper limit on unexpected mechanical cost. The modeller does not need to build a large, vague “catastrophic failure” reserve into the t/km rate, which keeps pricing competitive for tender and spot long‑haul contracts.
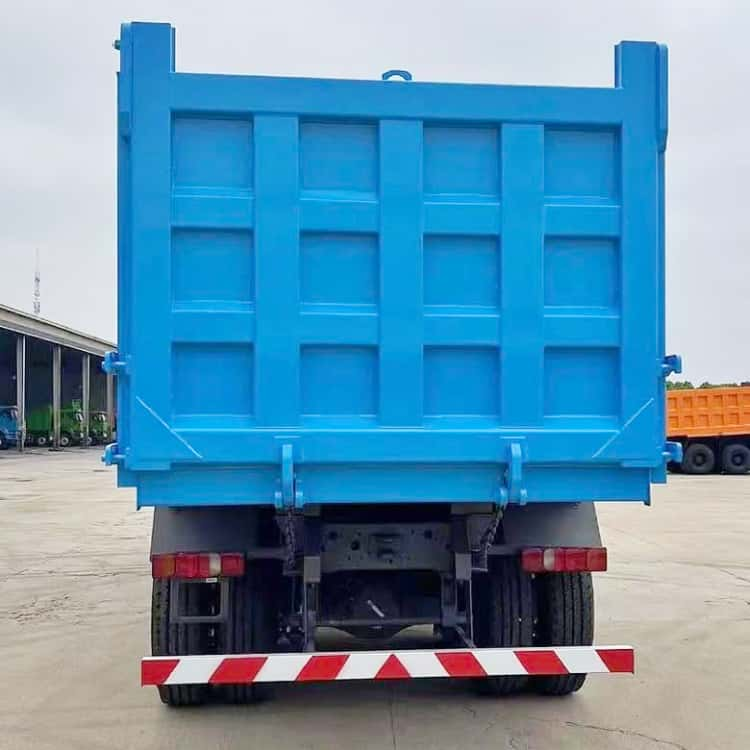
Telematics Validation Lets Actual t/km Feed Back Into Forecasts
Standardised reman trucks are tracked via telematics, logging distance, payload, fuel use and fault events. Fleet analysts can compare real-world per-unit t/km against the forecast baseline.
If one unit drifts outside the expected band, the cause is traceable: out-of-grade operation, fuel quality issues, or calibration drift. This closed-loop feedback lets the team refine forecasting assumptions over time, making subsequent route and contract estimates even more accurate.
Boundary Note
Standardised reman trucks does not lock t/km into a fixed, unchanging number. Route terrain, load factor, driver behaviour, fuel price inflation and tolls still shift the final cost. What it eliminates is the avoidable variance caused by inconsistent rebuild quality and unknown mechanical history. A well-run reman fleet still needs to adjust forecasts for route-specific conditions, but the asset-level noise is removed.
Q&A
Q: Can I use this same t/km baseline for cross-border long-haul? A: Yes. The consistent reman standard and traceable dossier support stable cost modelling across multi-country routes, though you still need to add local toll, tax and border delay assumptions.
Q: How does this help when bidding long-term haul contracts? A: It lets you submit a stable t/km rate with smaller risk contingency, improving competitiveness while protecting margin against unexpected mechanical cost shocks.
Q: Does standardised reman trucks mean every truck will achieve identical t/km? A: No. Driver style and payload variation will still create minor differences. The variation band is much narrower than with uncertified used stock, so forecasts remain reliable.