
How Reman Creates Comparable ROI Profiles Between New, Used and Verified Reman Vehicles?
Intro
Traditional ROI comparisons between new trucks, generic used trucks and reman units are usually unreliable. New trucks carry high upfront capital and slow payback. Uncertified used trucks often show attractive paper ROI, but hidden failures and unplanned downtime erase projected returns. Verified reman vehicle introduces a controlled, audited asset class with a defined lifecycle reset. This lets finance and tender teams build side-by-side ROI models that use the same set of risk, uptime and residual-value rules, rather than comparing apples to oranges.
The Core Problem: Inconsistent Risk Inputs Break ROI Comparisons
When fleets run ROI calculations without standardised asset grading, each category uses different implicit assumptions. New-truck models assume high uptime, factory warranty and steep early depreciation. Used-truck models frequently ignore latent fatigue and emergency repair exposure, or apply a vague, unquantified risk contingency. There is no shared baseline for downtime, failure probability or residual value. This creates misleading outputs.
A used truck may appear to deliver 30% annual ROI on the spreadsheet, but that result collapses after one catastrophic powertrain failure. A new truck may look low-return, yet its stable uptime protects revenue through volatile site conditions. Verified reman vehicles bridges this gap by imposing a uniform evaluation framework that applies the same financial logic to all three asset groups.
Verified Reman Vehicles Provides a Defined Middle Baseline
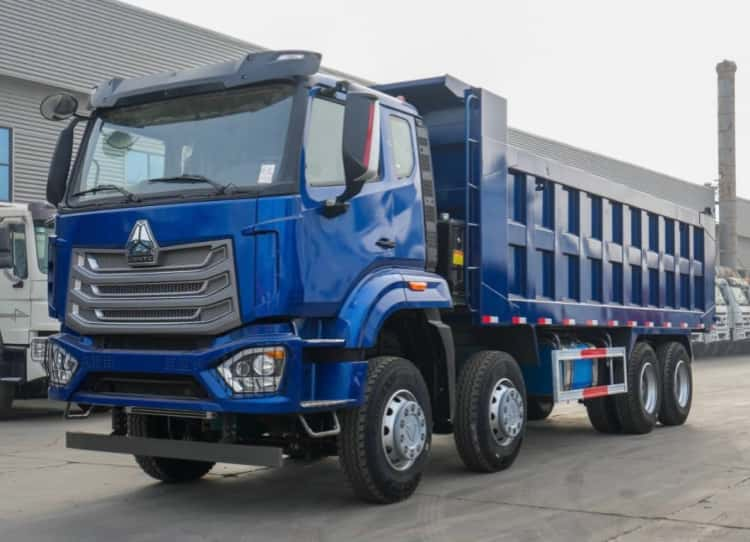
REMAM ROAD verified reman vehicle sits as a calibrated reference point between new and uncertified used assets. Each verified reman vehicle carries a formal rebuild scope, NDT screening records, bench test results, assigned duty grade and warranty. This fixed specification gives modellers a known failure rate, predictable wear progression and auditable residual curve.
Instead of treating “used” as a single high-risk bucket, the portfolio splits into three controlled tiers: new with full OEM warranty, verified reman with rebuild warranty, and ordinary used with no formal quality guarantee. All three are modelled against the same site utilisation, haul revenue, fuel cost, labour rate and downtime penalty schedule.
The verified remanufacturing baseline becomes the common yardstick. If a used truck cannot match the reman uptime and maintenance assumptions, its modelled ROI is adjusted downward to reflect that extra risk. If a new truck delivers higher reliability but higher capital cost, its ROI is calculated using identical uptime metrics.
Reset Depreciation and Residual Forecasting Enable Level Comparison
Ordinary used trucks are depreciated from original manufacture date, with residual value heavily discounted by unknown history. New trucks follow a steep first-life depreciation curve.
Verified reman vehicles uses the reset lifecycle depreciation model, starting its value decay from the rebuild completion date. This does not mean verified reman vehicle is treated legally as a new vehicle. It means the economic write-down and residual forecast are separated from the truck’s first-life wear. Grade-specific residual benchmarks let analysts compare terminal equity consistently across all three asset types.
When every asset’s exit value is forecast on the same methodology, payback and ROI percentages become comparable. The biggest distortion in traditional fleet modelling — wildly different residual assumptions — is removed.
Standardised Maintenance and Downtime Curves Align the Cost Side
The largest variable that skews ROI is unplanned downtime and surprise repair expense. New trucks have minimal maintenance contingency while OEM warranty is active. Verified reman vehicle has a modest, bounded contingency reserved only for misuse and overload damage, with rebuild defects covered by warranty. Generic used trucks require a large, open-ended contingency for hidden component failures.
With REMAN ROAD standardisation, maintenance schedules are predictable and repeatable. Planned service intervals, parts consumption and diagnostic labour are documented. Modellers can assign a defensible annual maintenance cost to each asset category, rather than guessing. When revenue per operating hour is identical for all trucks on the same quarry or haul route, the ROI difference only reflects capital outlay, depreciation and structured risk, not unquantified guesswork.
Warranty Transferability Reduces Subjective Risk Discounts
Warranty is a critical equaliser for ROI modelling. New trucks carry OEM warranty. Verified reman carries transferable rebuild warranty. Ordinary used trucks carry no formal mechanical coverage. In the ROI formula, warranty coverage acts as a measurable risk offset. The model can explicitly price the value of warranty protection.
A used truck’s apparent ROI advantage is reduced by the expected cost of one or two major failures over the holding period. Verified reman vehicle’s warranty caps that downside, bringing its risk profile closer to new trucks, while keeping its capital investment far lower.
Matching Holding Period to Asset Lifecycle
For fair ROI comparison, each asset’s planned holding window must align with its viable profit window. New trucks are typically modelled for long ownership cycles. Verified reman vehicle is optimised for medium, fixed-term contract durations that match its warranty and reliable post-rebuild service life. Generic used trucks are best suited only for very short holding periods before major failures are likely.
When ROI is calculated over a mismatched timeline, results are meaningless. By anchoring reman to its designed profit window, fleet planners can compare: new for long-cycle steady work, verified reman vehicles for medium fixed-term contracts, and used only for short, low-stakes assignments. Each ROI output is valid within its intended use case.
Boundary Note
Comparable ROI profiles do not mean equal ROI. Verified reman vehicle creates a consistent way to measure them, not force all three assets to deliver identical returns. Even with audited rebuild records, reman will not match the full factory support of a new truck, and it will not carry the ultra-low purchase price of high-risk used stock. The value is transparency: finance teams can see exactly which trade-offs drive the return, rather than relying on optimistic or incomplete assumptions.
Q&A
Q: Does this mean verified reman vehicle always lands between new and used in ROI ranking? A: Often, but not always. In high-duty quarry contracts with a 24–36 month term, verified reman vehicle can deliver a higher ROI than new trucks, while still carrying far lower risk than uncertified used alternatives.
Q: Can this framework be used for tender pricing? A: Yes. It allows you to run multiple bid scenarios, selecting the optimal mix of new, reman and used assets and showing the finance team the ROI and risk trade-offs clearly.
Q: What if a used truck has complete service history? A: Well-documented used trucks can be assigned a separate, improved risk tier, but they still lack the full disassembly, NDT screening and component renewal that defines the remanufacturing baseline.